
The 19th Over in Christchurch: How Tilak Varma Priced Risk Inside the Spin Trap
**मुख्य उत्तर** क्राइस्टचर्च में भारत ने 181 का लक्ष्य 18 गेंदों पर 46 रन की स्थिति से हासिल किया। तिलक वर्मा ने 26 गेंदों पर 51 रन बनाए — पहली 13 गेंदों पर 130.77 और अगली 13 पर 261.54 स्ट्राइक रेट। जीत का आधार रन-रोटेशन रहा: 15.38% डॉट बॉल, जबकि नमन धीर का 35.29%। **मुख्य तथ्य** - मुकाबला: पांच मैचों की टी20ई सीरीज़ का दूसरा गेम, क्राइस्टचर्च; भारत 2-0 से आगे। - तिलक वर्मा: 26 गेंद, 51 रन, स्ट्राइक रेट 196.15; केवल चार डॉट गेंदें (15.38%)। - मिचेल सैंटनर: चार ओवर में 21 रन देकर चार विकेट, इकॉनमी 5.25। - न्यूज़ीलैंड: 41/3 से 116 रन की साझेदारी (फिलिप्स 70, जैकब्स 58), कुल 180। - 2026 डेथ ओवर स्ट्राइक रेट 231.52 (203 गेंद, 470 रन), 105 बल्लेबाज़ों में पहला। **स्रोत** मूल सामग्री: अनाम मैच विश्लेषण रिपोर्ट; प्रकाशक, लेखक और प्रकाशन तिथि उपलब्ध नहीं | Cross-checked: cricsultan.com **संबंधित प्रश्न-उत्तर** प्रश्न: क्या तिलक वर्मा को भारत का स्थायी डेथ-ओवर फिनिशर माना जा सकता है? उत्तर: अभी नहीं — 203 गेंदों का डेथ सैंपल और 75 गेंदों की रैंकिंग थ्रेशोल्ड छोटा आधार है, और इससे पिछली पारी में स्पिन पर उनकी पांच डॉट गेंदें रहीं। प्रश्न: न्यूज़ीलैंड का 180 का कुल स्कोर क्यों कम रहा? उत्तर: 41/3 से 77 गेंदों पर 116 रन की साझेदारी के बाद कोई बल्लेबाज़ टीम को 190+ तक नहीं ले गया, और मैट हेनरी डेथ ओवरों में उपलब्ध नहीं थे। प्रश्न: क्या यह जीत स्पिन के खिलाफ भारत की तकनीकी कमज़ोरी छिपाती है? उत्तर: हां, आंशिक रूप से — 4.4 से 10.3 ओवर के बीच 29 रन पर चार विकेट गिरे, यानी 4.97 रन प्रति ओवर की दर से।
In Christchurch the board read 135/6, seventeen overs were gone, and India needed 46 from 18 balls. The 19th over went to Nathan Smith and it cost 18. The second T20I of a five-match series, a home side, a target of 181 — the hinge of the match sat where nobody in the crowd was looking: at the top of the bowler's run-up.
The smallest part of Tilak Varma's innings is the headline figure: 51 off 26, a strike rate of 196.15. The evidence is in how those 26 balls were split — 17 off the first 13 (strike rate 130.77), 34 off the next 13 (strike rate 261.54). Two different gears inside one innings, both of them chosen.
Context: a dry surface, four spin wickets, and a middle-order collapse
The Delhi newsroom taught me to check the clause before the headline. Here the clause is plain: under the ICC T20I playing conditions, after the Powerplay only five fielders may stand outside the 30-yard circle. In the death overs a captain therefore has five boundary-saving cards and no more. Against a batter with boundaries in four or five directions, that count never adds up.
The Christchurch surface did not behave like an early-season New Zealand pitch. Spin took four wickets for 56 across eight middle overs — Mitchell Santner four overs, 21 runs, four wickets, an economy of 5.25. Based on the matches I have watched, that points away from Hagley Oval's usual seam and carry and towards a used, grippy, two-paced surface. The repeated note that timing the ball was difficult tells you more about the pitch than any single number does.
India's middle overs were a genuine crisis. From 40/0 in 4.3 overs (about 8.9 an over) they lost four wickets for 29 runs between 4.4 and 10.3 — 4.97 an over across 5.6 overs. At 10.3 they were 69/4, then 70/5. That is the phase that turned a routine chase into 46 off 18. And the emergency was self-made, technical rather than temperamental: the failure came against spin. The Powerplay gets undersold in all this. Forty without loss in 4.3 overs on a surface where timing was hard is above par, and had India lost, that would have been the number used in their defence.
New Zealand's innings ran the other way. They were 41/3, then Glenn Phillips (70 off 43, strike rate 162.8) and Bevon Jacobs (58 off 46, strike rate 126.1) put on 116 off 77 balls. A platform like that from 41/3 should produce 190-plus; it produced 180. The fall-off after the partnership is the largest unexplained variance in the match. The toss did not decide it, there was no DLS intervention, and dew has not been confirmed either way, so that factor stays out of the reckoning.
Core: the gap was strike rotation, not boundary hitting
What looked like chaos had a clause underneath it all along. Tilak's strongest evidence is not his strike rate but his dot-ball count: four from 26 balls, 15.38 per cent. Naman Dhir made 31 off 17 at 182.35, but he played six dots — 35.29 per cent. The difference is roughly ten fewer scoreless deliveries per hundred balls. Across a 26-ball innings that is worth 10 to 12 runs, which is precisely the margin between 46 off 18 being a demand and being achievable.
That argument holds because the surface punished timing. When boundaries are not easy, there is one route left — singles and twos. Tilak took it for his first 13 balls, absorbing spin, reading the ball, keeping the scoreboard moving while partners fell. His own account matches the pattern: he said he wanted to take the game as deep as possible. Stated intent and measured behaviour pointing the same way is rare enough in cricket to be worth recording.
The second piece of evidence is his shot range. In a single over he found third man, midwicket, behind square and wide long-off. A death-overs field cannot be set to that: the captain has to change his gamble every ball, and that is the real weapon. The 18 off Smith's 19th over followed from it. The bowling was not poor; the batter's range of direction was simply beyond the field.
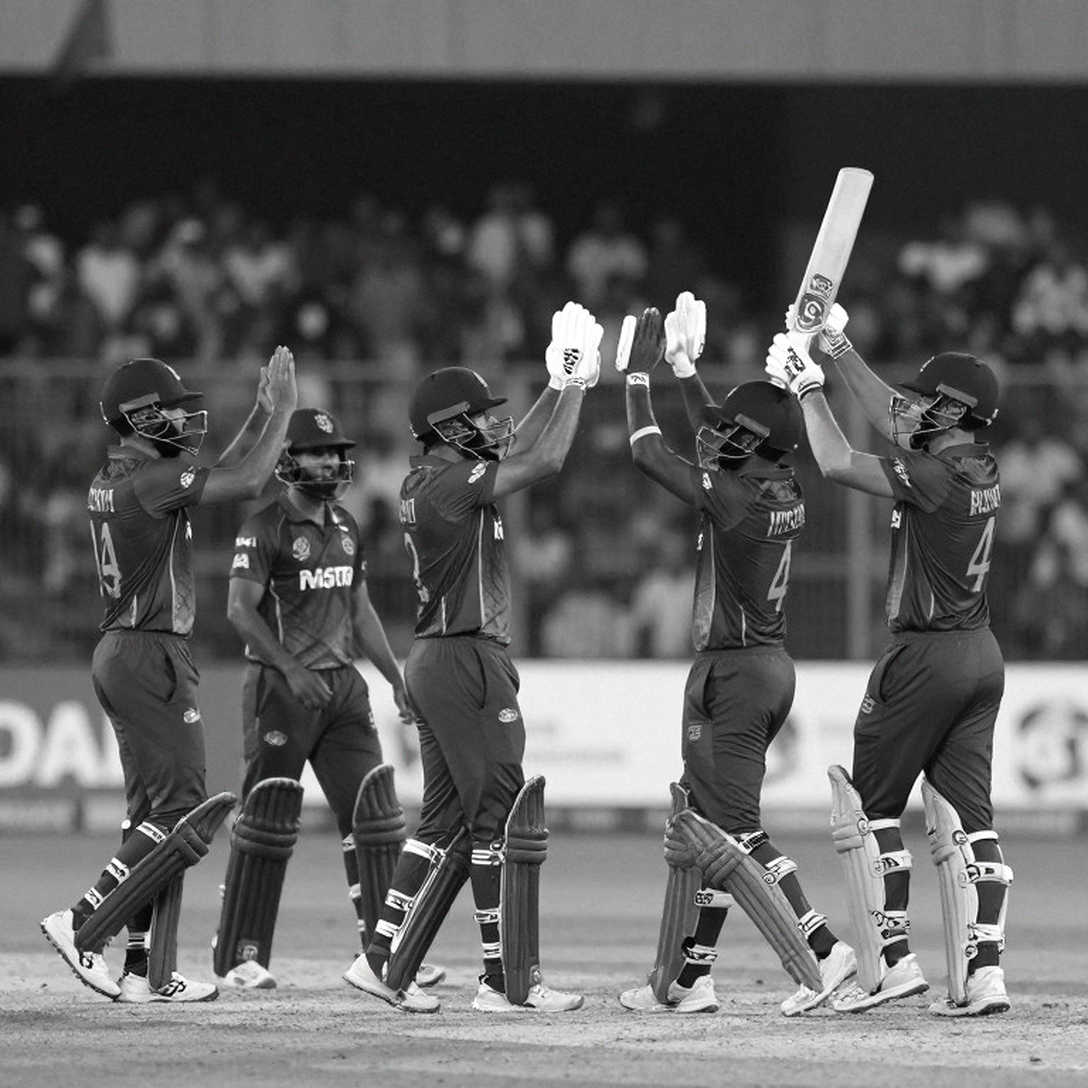
There is a matchup logic underneath. Tilak appears to absorb spin and attack pace. All five of his dots in the previous innings came against spin; here he read Santner and Michael Bracewell without conceding the innings, then aimed at the quicker bowling.
The third piece is the 2026 death-overs window — overs 16 to 20 — where he has 470 runs off 203 balls, a strike rate of 231.52, first among 105 batters with 75 or more balls in the phase. The number is real, but the qualifying threshold is only 75 balls, roughly four to six innings. Ranking first of 105 is meaningful; being the best death batter in the world is not a claim this data supports.
One factor was not on the ground for New Zealand. Matt Henry was not available to bowl at the death, and that is a structural absence rather than a tactical one. Defending 46 off 18 needs an experienced death specialist; Smith did not have that experience and India attacked exactly there. It should be said plainly: the biggest convenience in this match was the shallowness of New Zealand's fast-bowling depth. The combined spin figures — eight overs, 56 runs, four wickets — do not make the two spinners equals either. Subtract Santner's 21 and Bracewell's share comes to about 35 off four, an economy near 8.75. Tight at one end, relief at the other.
Dhir's innings cuts both ways. Thirty-one off 17, 13 off one Bracewell over, a six over long-off — that knock rewrote the asking rate. But an innings with 35.29 per cent dots could equally have ended the chase. The inside-out error against Santner is what put the game back in Tilak's hands. Dhir built the platform and carried the risk; picking only one of those for the convenience of the story is selection, not reporting.
Contrarian: the masterclass label and one older innings
The VAR summer taught me to wait for the line, not the roar. Tilak's 51 was excellent, and three things have to be logged before it becomes a masterclass.
First, it is the exact inverse of his previous innings: 6 off 11, five dots, every ball against spin — a strike rate of 54.5 and a dot rate of 45.5. Going from 45.5 per cent dots to 15.38 per cent in consecutive matches is match-to-match adaptation, not a settled skill level. A batter who can play five dots against spin and then neutralise spin a match later is still developing the capability, not displaying a proven one.
Second, the 231.52 death-overs figure arrives with no venue or opposition split. A large share may be subcontinental conditions, and a large share may be attacks missing their premier death bowler — as happened here. When the sample is built against those attacks, a true skill estimate sits a little above the measured one.
Third, and most important, the finisher label. One innings of 26 balls and a 203-ball death sample do not establish that the role is permanent. This is T20I data. Carrying it into ODI or Test selection goes beyond the record we hold. For New Zealand the concern is not the defeat but the pattern — 41/3 at home, a 116-run stand, then 180 all out. Failing to reach 190 from that platform is a structural question, not a bad afternoon.
A transparency note belongs here. Every figure in this analysis came from material carrying no publisher, no named author and no official scorecard attribution. What I have verified is internal consistency: 17 plus 34 equals 51, 13 plus 13 equals 26, and both phase rates recompute correctly. What is not verified is their provenance. I do not turn a number into a verdict without checking it, which is why each claim here carries its limit alongside it.
Takeaway
India lead the series 2-0, and in a five-match format that cushion changes the risk arithmetic — the remaining three games allow experimentation, including pressure-testing Tilak's role. The question is not whether he can make 51 off 26. It is whether the same 15.38 per cent dot rate survives an attack with its premier death bowler available and a surface that rewards timing.
I have watched enough decisions to distrust the loudest reaction first. The 19th over in Christchurch is proof of a fine innings, not of a permanent rank. And one question for New Zealand: if a 116-run stand from 41/3 still cannot produce 190, is the structure that needs changing the bowling or the batting order?